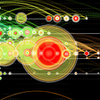
Visualizes scientific literature with interactive co-citation maps to reveal research trends and influential works
Visualizes scientific literature with interactive co-citation maps to reveal research trends and influential works
Vote (2 votes)
Program license Free
Developer citespace
Version 5.7.R2
Works under Windows
Vote
(2 votes)
Developer
citespace
Works under
Windows
Program license
Free
Version
5.7.R2
Pros
- Powerful bibliometric and network analysis features
- Interactive, customizable scientific visualizations
- Supports multiple data sources and formats
- Free and platform-independent
- Excellent for tracking field evolution and emerging research
Cons
- Steep learning curve for new users
- Interface can be overwhelming at first
- Requires data preprocessing and careful setup
- Performance may lag with extremely large datasets
Visualize and analyze scientific literature trends with advanced network mapping.
Comprehensive Scientific Visualization Tool
CiteSpace is a specialized application focused on mapping the intellectual structure and evolution of research domains. Designed primarily for researchers, analysts, and librarians, it processes bibliographic data from major academic sources and generates compelling, interactive visualizations to reveal connections, trends, and emerging topics in scientific literature.
Deep Analysis of Knowledge Domains
CiteSpace empowers users to scrutinize substantial bibliographic datasets—such as those from Web of Science, Scopus, Dimensions, and The Lens—to identify influential articles, pivotal themes, and citation bursts. It highlights the evolution of a research field by pinpointing core references and clustering related works, making it invaluable for tracing scientific breakthroughs, shifts in research foci, and intellectual milestones.
Flexible Data Handling
The tool supports a wide array of databases and formats, giving users the freedom to analyze works from diverse sources like PubMed, CNKI, and ProQuest Dissertations. Users import reference or citation records, and CiteSpace translates these inputs into multi-layered networks—encompassing co-citation, co-authorship, and keyword co-occurrence patterns. Its compatibility with multiple node and edge types allows complex, hybrid network analyses that encapsulate institutions, countries, and research themes.
Advanced Visualization Capabilities
CiteSpace excels at generating detailed, interactive maps that illustrate relationships such as collaboration networks, emerging research fronts, and geospatial patterns of scholarly activity. Not only does it offer cluster labeling using extracted terms, but it also provides time slicing and burst detection, enabling temporal trend analysis. This provides clear, interpretable visuals of how domains progress, making it easier to spot influential works and forecast future directions.
User Experience & Accessibility
While CiteSpace’s interface may appear daunting to new users, especially those unfamiliar with academic network analysis, its thorough documentation and active user community are valuable resources. The application is free to use, and platform-independent thanks to its Java-based implementation, making it easily accessible to researchers worldwide. Regular updates ensure compatibility with new data sources and the latest bibliometric analysis methods.
Use Cases and Limitations
CiteSpace is particularly powerful for mapping scientific landscapes, supporting dissertation research, systematic literature reviews, and institutional reports. However, users must prepare data carefully and have a basic understanding of network concepts to harness its full potential. The learning curve can be steep, and visualization customization, while powerful, may feel complex to beginners. Performance may also be affected when working with extremely large datasets.
Pros
- Powerful bibliometric and network analysis features
- Interactive, customizable scientific visualizations
- Supports multiple data sources and formats
- Free and platform-independent
- Excellent for tracking field evolution and emerging research
Cons
- Steep learning curve for new users
- Interface can be overwhelming at first
- Requires data preprocessing and careful setup
- Performance may lag with extremely large datasets